If you have ever worked a drive-thru window, 5:24 from lane to exit sounds unacceptable by many franchise speed-of-service standards. It is also the best the industry has posted in eight years. In the 26th Annual QSR Insight Drive-Thru Study, the average visit improved by 11.1 seconds from 5:35 in 2025, the fastest result since 2018.
The bar is low enough that half of all visits finished in under 4:25, and the fastest quarter finished in under 2:54, roughly half the average. At the other end, the slowest 10% ran past 9:56. Of those on visits under three minutes, 80.2% would recommend the brand, compared with 60.4% of those on visits over ten.
Speed still decides the visit. Of the 2,145 mystery shoppers across 13 brands, 38.4% named it the most important factor, ahead of order accuracy at 28.4% and food temperature at 20.6%. The seconds worth winning back sit in specific phases and specific visits, and an average cannot show them. This guide walks through the findings that matter most for QSR and convenience operators and shows where AI is helping operators get back their seconds.
1.Where the 11 seconds came from: how 5m:35s became 5m:24s
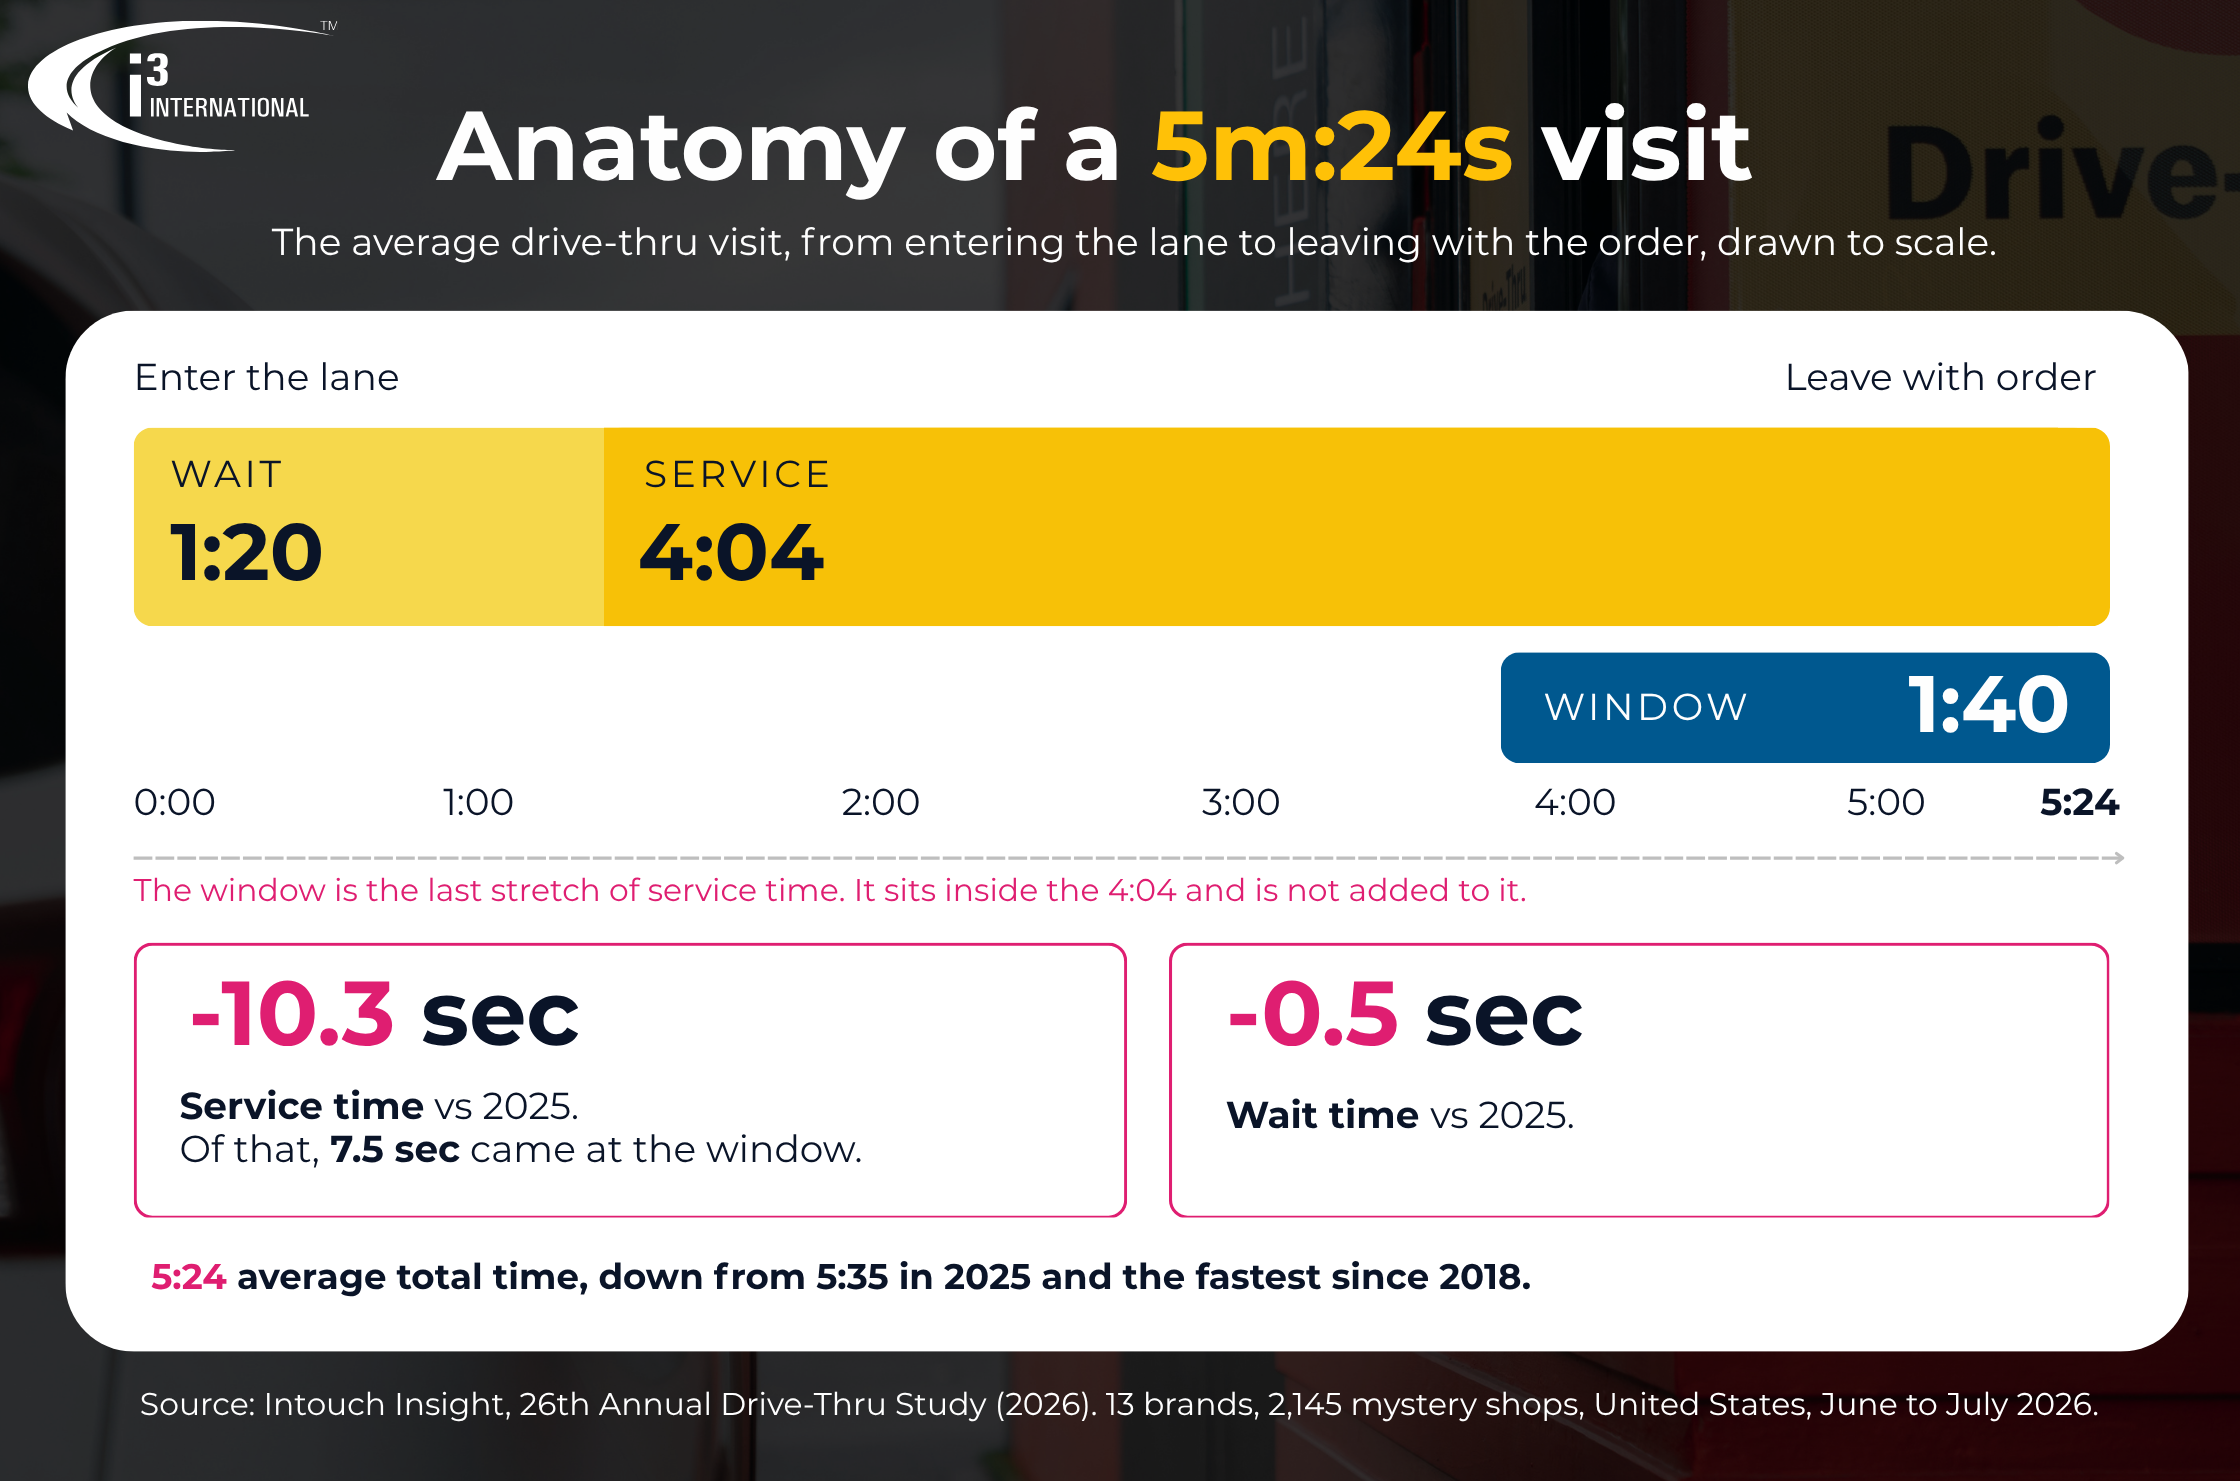
The study splits every visit into measures that add up. Wait time runs from entering the lane to starting the order, and service time runs from starting the order to leaving with it. Window time, the stretch from arriving at the pickup window to receiving the whole order, sits inside service time. In 2026 the average visit was 5:24: 1:20 of wait plus 4:04 of service, with 1:40 of the service portion spent at the window.
Almost all of the 2026 improvement came out of service time, which improved by 10.3 seconds. The window accounts for 7.5 of those seconds, nearly three quarters of the gain. Wait time improved by only 0.5 seconds. Since the 2021 peak, wait time has dropped 21%, from 1:42 to 1:20, almost all of it in 2023, and it has stayed flat for four years. Service time is down 13% over the same period and is the only part still falling.
What to measure: Track every phase of the visit separately, not total time alone: the wait before the speaker, the order itself, the move to the window, the handoff and the exit.
What the data points to: The study ties the 2026 gain to service time and the pickup window, and shows wait time flat since 2023. The report does not give causes, so operators need their own phase data to see why.
What good analysis looks like: Compare each location against its own phase history and against peers, by daypart. A store that is average in total time can still be slow in one phase.
How AI helps: AI-based video analytics can time each phase of a visit automatically, at every location and in every daypart, so teams can see how long each phase takes as well as the total time. Phase timing is most useful when it is compared by location and daypart, which turns a flat number like wait time into a short list of stores and hours to look at first.
The i3 Velocity Timer applies this to the drive-thru. It tracks the phases of a visit, from pre-order and speaker through line wait, window, order wait, curbside, ingress and egress, using AI, POS data and video. Timing metrics reach operators on a mobile dashboard, so a manager can see which phase is slow.
2.What the average hides: the slow visits
The study’s most useful chart for operators is the distribution. The average visit took 5:24, but half of all visits finished in under 4:25. The fastest 25% took under 2:54, and the slowest 10% took longer than 9:56, with the longest running to 44:56. A small number of very long visits pull the average up.
Those long visits carry a cost the satisfaction scores show clearly:
| Total time | Visits | Satisfied | Would recommend |
| Under 3 minutes | 570 | 95.4% | 80.2% |
| 3 to 5 minutes | 683 | 94.7% | 81.7% |
| 5 to 7 minutes | 387 | 94.6% | 78.3% |
| 7 to 10 minutes | 293 | 94.2% | 75.4% |
| Over 10 minutes | 212 | 84.9% | 60.4% |
Order accuracy on the over-10-minute visits was 92.0%. The order is usually still right, and the guest is less likely to recommend. Perception follows the same pattern. On 14.2% of visits the shopper said the experience was slower than expected, and only 12.8% of those shoppers were very likely to recommend, against 65.3% of those who said it was quicker than expected.
Restaurant Brands International, the parent of Tim Hortons, estimated in its second-quarter 2025 results that one second of drive-thru improvement leads to roughly $30,000 (Canadian) of incremental annual sales per restaurant. Guest satisfaction rose more than four points that year, the company said, to its highest level since it began tracking in 2018. That is one brand’s estimate in one market. The 2026 study shows the same stakes in its own measure: guests on visits over ten minutes were far less likely to recommend the brand, 60.4% against 80.2% for visits under three minutes. Tim Hortons also posted the fastest total time in the study, 4:20.
What to measure: The share of visits over a threshold, such as 7 or 10 minutes, by location and daypart, in addition to the average.
What the data points to: The study notes that a few very long visits pull the average up, and calls them “the visits where things go wrong.” It does not say why they run long, which is why the slowest visits need a closer look each week.
What good analysis looks like: Pull the slowest visits each week, see which phase ran long and look at the POS record and video of those visits together.
How AI helps: Slow visits are easy to miss in a summary and easy to spot when software does the sorting. AI-based analytics can flag long queues as they build, rank the slowest visits of the week and pair each one with its timing, so a manager reviews a short list instead of scrolling through hours of footage. The goal is to see which visits ran long and to learn why while the day’s details are still fresh.
i3Ai Customer Overflow applies this to the front counter and Velocity Times applies this in the drive-thru queues. It watches queues against thresholds for queue length and wait time that the operator configures. With i3’s Ai Customer Overflow when a queue outgrows the staff on hand, managers get an alert in the CMS mobile app, with timestamped video, so they can redeploy people while the line is still building. The same video record shows what happened on the visits that ran long.
3. Lanes, stations and queue length
Queue length and speed do not move together as simply as operators expect. The average line held 1.3 cars across the study. On the study’s index, where 2018 equals 100, cars in line sit at 63 while total time sits at 108, so lines are shorter than in 2018 and visits are slightly longer.
Brand results show how different lanes can be. Chick-fil-A averaged 3.0 cars in line and a 7:06 total time, which works out to 2:21 per car in line. Arby’s averaged 0.5 cars and a 4:53 total time, or 10:54 per car in line. A longer line with a fast lane, or a short line with a slow one, produce very different guest experiences from the same raw wait.
Lane design matters too. Single-station lanes averaged 3:18 in total time (n=193), two-station lanes 5:31 (n=1,743) and three-station lanes 6:27 (n=206). Shoppers also rated how the lane felt: visits rated perfectly smooth averaged 4:45 with 97.1% satisfied, while visits rated frustrating averaged 11:18 with 42.9% satisfied.
What to measure: Cars in line by hour, time per car in line and the split of time between ordering and the window.
What the data points to: More stations came with longer total times, and the lanes guests rated frustrating ran more than twice as long as the smooth ones. The study shows the pattern without isolating the cause.
What good analysis looks like: Look at queue length and phase time together. A line that looks short but moves slowly points to a window or kitchen issue.
How AI helps: The Velocity Timer handles single and dual-lane configurations. Combined with i3’s Ai License Plate Recognition, it can detect an approaching vehicle and loyalty customers so staff can start preparing the order sooner. i3’s patented queue management system (US Patent 11,948,110 B2) uses cameras to measure wait times for vehicles in drive-thru lanes and indoor queues.
4. Accuracy and friendliness still move the score
Order accuracy rose to 89.3% in 2026, 2.4 points better than 2025, and 10.7% of orders still had something wrong. Among the 229 inaccurate orders, 43% involved a customization that was not provided correctly, 13% a packaged condiment request that went unfilled, 13% the wrong main item and 11% the wrong ingredients. Brand results ranged from 81% to 96%.
Friendliness has a large effect on how guests rate the visit. When service was rated friendly (n=1,694), 98.6% of shoppers were satisfied and 86.5% would recommend. When it was rated not friendly (n=56), 26.8% were satisfied and 19.6% would recommend. Average total time was 5:16 in the first case and 5:41 in the second, so time alone does not explain the gap.
What to measure: Accuracy by daypart and by order type, and timing at the window alongside the POS record.
What the data points to: Customizations lead the list of errors at 43%, followed by condiment requests, wrong items and wrong ingredients.
What good analysis looks like: Review the visits where the order was wrong and check the timing of the order, the handoff and what the POS recorded.
How AI helps: The Velocity Timer sets POS data and video beside each visit’s timing, so an operator can review a specific visit instead of relying on a summary score.
5.Voice AI enters the lane
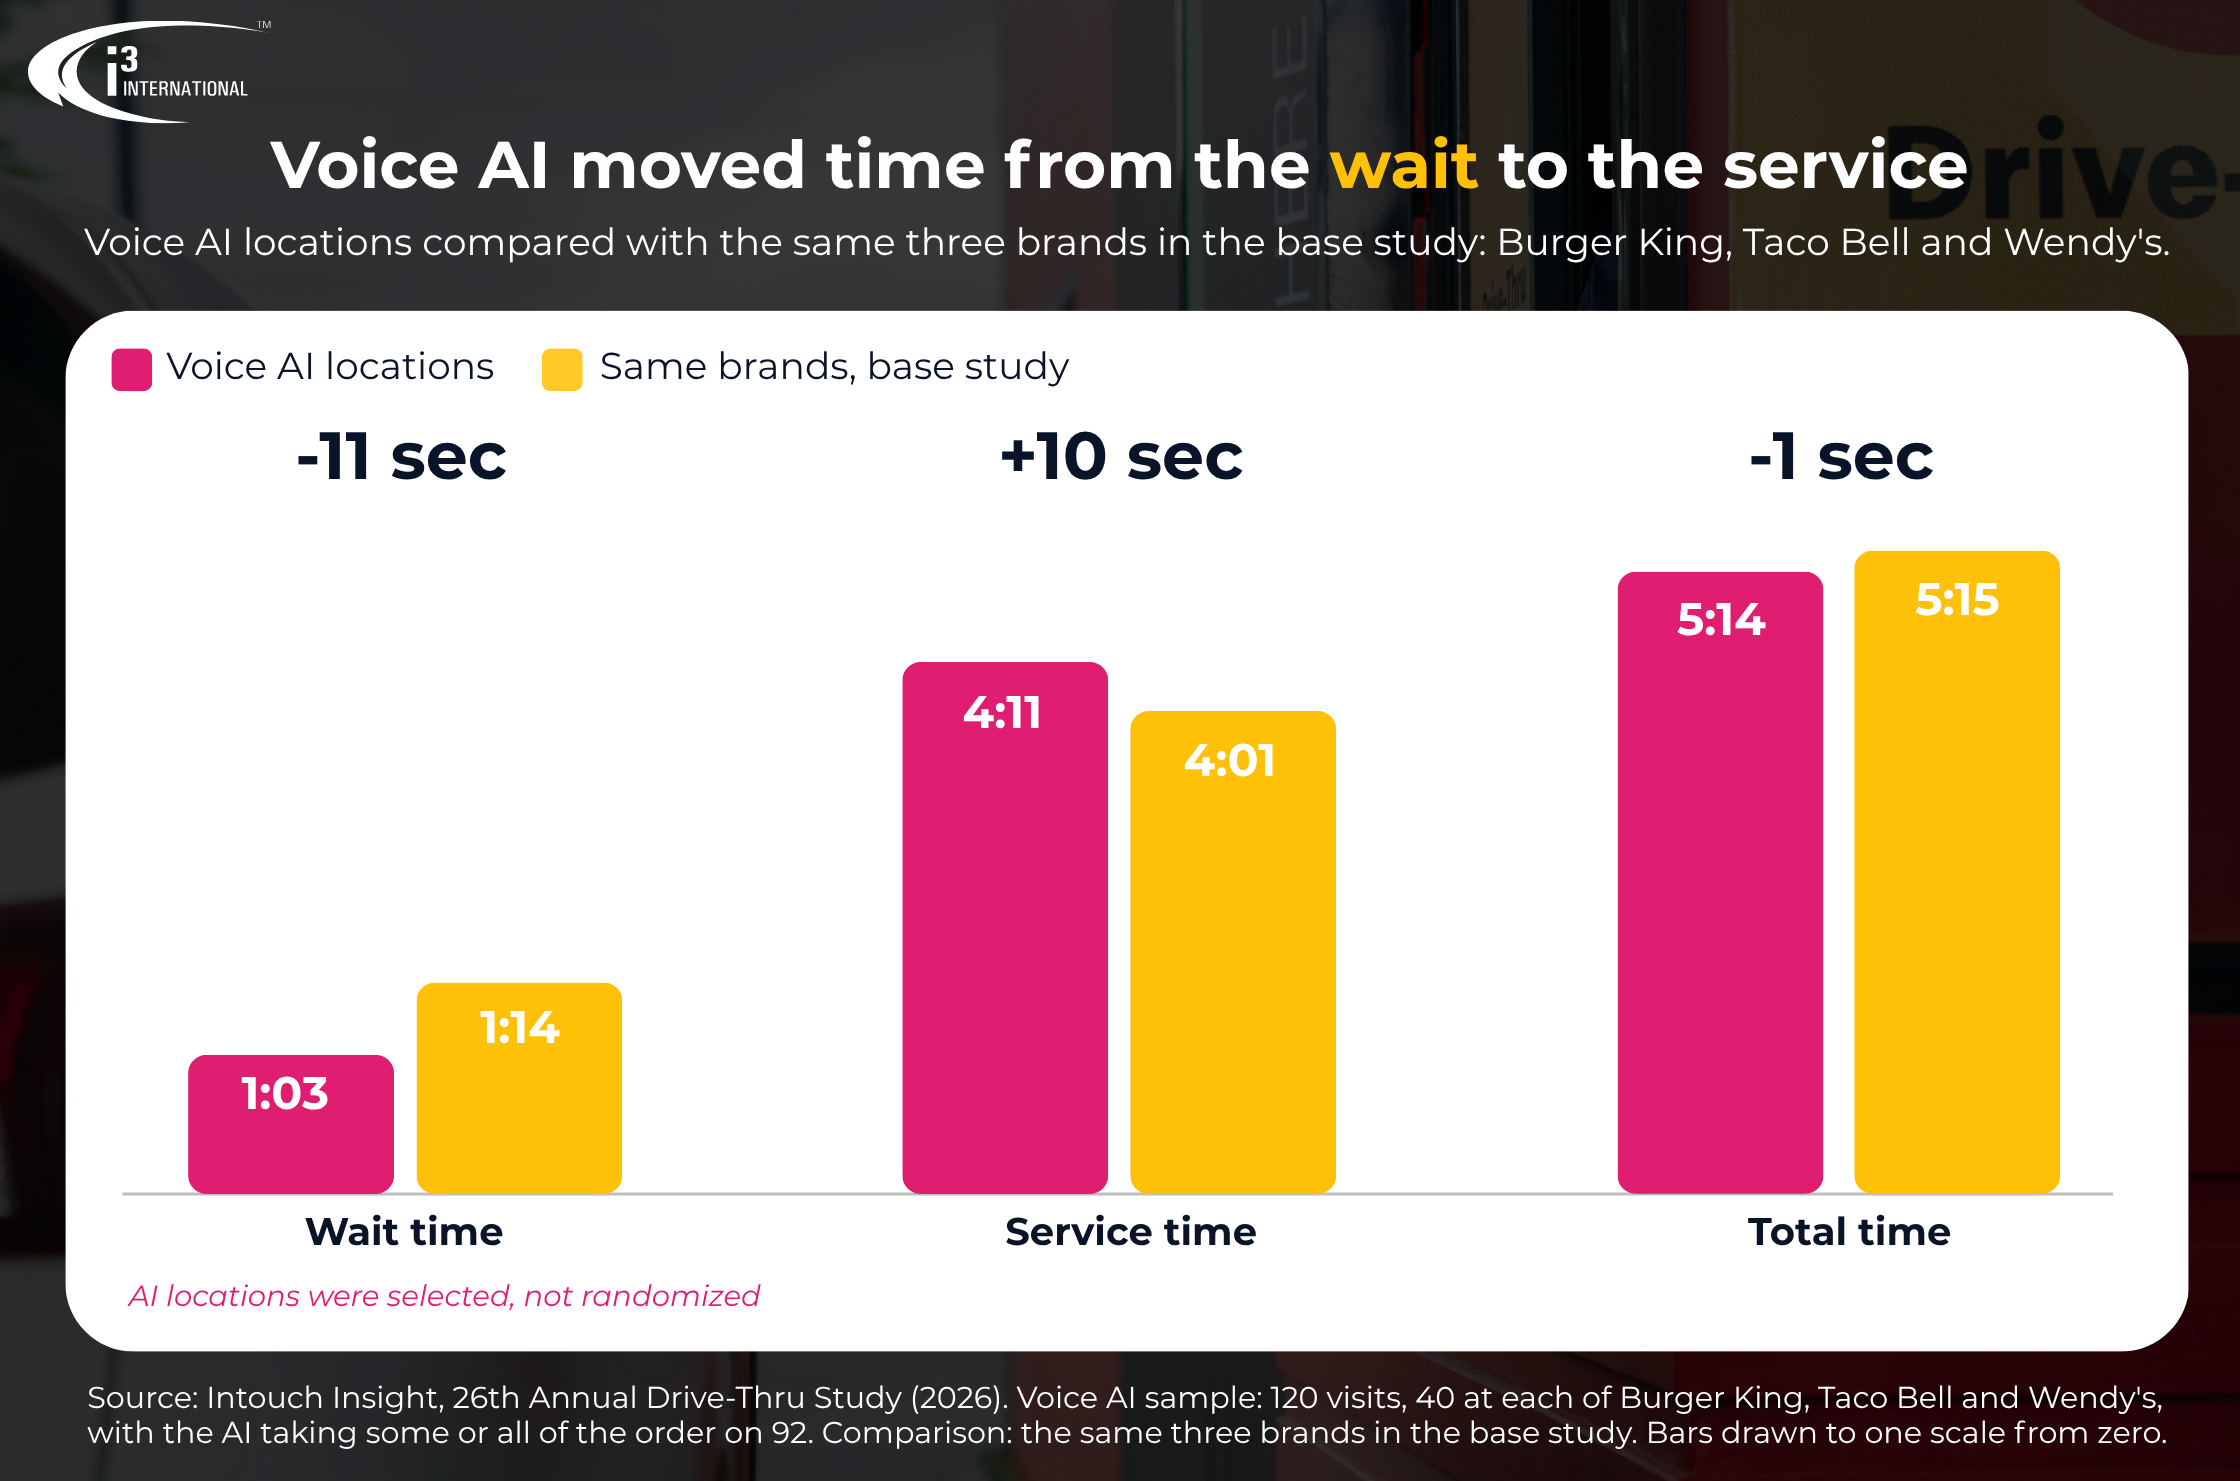
The 2026 study measured voice AI ordering on its own sample: 40 visits at each of three brands running it (Burger King, Taco Bell and Wendy’s), for 120 AI-enabled visits. On 92 of them the AI took some or all of the order. The study notes that most of what customers meet today is automation, and that at locations running voice AI almost every automated interaction was an AI taking the order.
Compared with the same three brands in the base study, AI locations looked like this:
| Measure | AI locations | Same brands, base study |
| Wait time | 1:03 | 1:14 |
| Service time | 4:11 | 4:01 |
| Total time | 5:14 | 5:15 |
| Suggestive sell offered | 79.2% | 59.2% |
| Had to repeat part of the order | 29.1% | 20.4% |
| Order accuracy | 90.8% | 86.7% |
| Overall satisfaction | 94.2% | 91.7% |
The visit took about the same time overall, with less wait and more service time. On the 92 visits where the AI took the order, 78.3% of shoppers rated its tone friendly, 63.0% found the interaction easy and 21.7% found it difficult. The study labels the comparison as descriptive, because AI locations were selected, not randomized.
What to measure: The same phase timing and accuracy measures on lanes with and without AI ordering, plus how often guests have to repeat part of an order.
What the data points to: At AI locations, time moved from the wait phase to the service phase while the total stayed level, which is why a total alone can hide a change.
What good analysis looks like: Judge any ordering technology by phase, accuracy and repeat rates on your own lanes, not by a total time.
How AI helps: Phase-by-phase timing works the same whether an employee or an AI takes the order, so an operator can see what changed in each phase.
What is the average drive-thru time in 2026?
The 2026 Intouch Insight Drive-Thru Study measured the average drive-thru visit at 5:24. Four points frame what that means:
- The average visit took 5:24 in total. That is 11.1 seconds faster than 2025 (5:35) and the fastest since 2018.
- The visit splits into 1:20 of wait and 4:04 of service. Window time, 1:40, falls inside service time, and the window carried most of the year’s improvement.
- Brands ranged from 4:20 to 7:06. Tim Hortons was fastest at 4:20, and Chick-fil-A was slowest at 7:06, though eleven of the thirteen brands landed within a minute of the study average.
- Half of all visits finished in under 4:25. A small share of very long visits pulls the average up, and visits over 10 minutes drop to 60.4% who would recommend
Frequently Asked Questions
What is a good drive-thru time?
In the 2026 Intouch Insight study, half of all visits finished in under 4:25, and visits under three minutes had 80.2% of shoppers saying they would recommend. The study average was 5:24. Time targets depend on menu, lane design and volume, so operators should compare each location against its own history, its daypart and similar peers.
Which drive-thru brand is the fastest in 2026?
Tim Hortons had the shortest average total time at 4:20, followed by KFC at 4:25 and Dunkin’ at 4:49. Chick-fil-A had the longest at 7:06, with the longest line at 3.0 cars. Each brand result rests on 165 mystery shops, and menu and segment differences affect comparisons.
Does voice AI make drive-thrus faster?
In the 2026 study, AI locations had about the same total time as the same brands in the base study, 5:14 against 5:15. Wait time was 11 seconds shorter and service time 10 seconds longer. Accuracy and satisfaction were higher at AI locations, and guests more often had to repeat part of an order (29.1% against 20.4%).
How is drive-thru speed of service measured?
The study times every visit from the moment the car joins the lane. Wait time runs from entering the lane to starting the order, service time from starting the order to leaving with it, window time from arriving at the pickup window to receiving the order, and total time is wait plus service.
How can AI help improve drive-thru speed of service?
AI-based timing breaks each visit into phases and ties the results to POS data and video, so operators can see which phase is slow. Queue alerts tell managers when a line outgrows the staff on hand, and license plate recognition can signal an approaching vehicle so staff start orders earlier.
What matters most to drive-thru customers?
In the 2026 study, 38.4% of shoppers named speed of service the most important factor, 28.4% named order accuracy and 20.6% named food temperature and freshness.
Ready to see your lane in phases?
An average total time says how long a visit took. Phase timing, queue alerts and POS and video records show where the time went and what to change first.
See how the i3 Velocity Timer and Speed-of-Service can help QSR and convenience operators act on drive-thru performance.
Sources:
- Intouch Insight. (2026). 26th Annual Intouch Insight Drive-Thru Study. Mystery shop study of 13 brands, 165 shops each, 2,145 visits, United States, June to July 2026. Voice AI sample: 120 visits at three brands. https://www.intouchinsight.com