How a Regional Grocer Uncovered Over $370,000 in Preventable Losses with i3Ai Sentry
About
XYZ Grocer operates over 30 grocery stores throughout the Midwest, consistently striving to improve operational efficiency and customer experience while reducing inventory shrinkage and enhancing store safety.
The Challenge
XYZ Grocer faced increasing losses from repeat offenders, vendor mismanagement, and inefficient staffing oversight, resulting in significant preventable financial losses.
The Solution: i3Ai Sentry
XYZ Grocer adopted i3 International’s i3Ai Sentry facial recognition software, integrating it with their existing surveillance infrastructure to identify and deter repeat unwanted visitors in real-time, strategically manage staff resources, and optimize vendor oversight.
Case Study on the Use of i3Ai Sentry in the Grocery Sector
This case study explores the implementation of i3’s i3Ai Sentry, a facial recognition software that leverages security cameras to identify individuals within the grocery industry. The focus is on a client operating over 30 grocery stores in the Midwest, referred to here as XYZ Grocer.
i3Ai Sentry is a novel addition to the grocery sector, aimed at addressing key operational challenges. XYZ Grocer initially adopted the technology to manage three primary concerns: deterring problematic individuals or shoppers, monitoring vendors' in-store activity, and managing staffing hours. One year after installation, the results exceeded expectations and differed from their objectives.
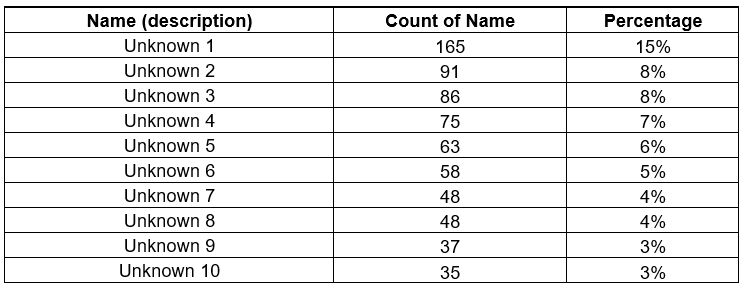
As of May 2025, XYZ Grocer reports average monthly sales of approximately $2.7 million across 60,000 transactions per store, with the average customer spending $43.40 per visit. These insights are drawn from the i3 Smart Exception Report, which integrates i3Ai Sentry with XYZ Grocer’s point-of-sale system. To date, XYZ Grocer has deployed i3Ai Sentry in 27 stores, with a total of 95 - M71 cameras, averaging 3 to 4 cameras per store. From April 13, 2024, to April 30, 2025, there are a total of 1,124 “Special Attention Shoppers” that entered the 27 stores, these special attention shoppers are categorized and sorted in top 10:
XYZ Grocer reveals that, over the period of February 17th through May 31st, 2025, they have identified 16 cases for further investigation. On average, each unwanted customer stole $320 USD from XYZ Grocer. Please refer to the graphs/diagram below reviewed on i3 CMS web for an explanation of the study.
The dashboard above gathers data from CMS Web, displaying information for a one-year period (April 2024 – May 2025).
This analysis highlights a fluctuating, yet overall rising, trend in repeat visits by unwanted customers across retail locations. Starting from a low of 20 incidents in April 2024, the count peaked at 94 in October 2024 and surged again to 87 in April 2025. Despite intermittent declines, the recurring pattern indicates a persistent and escalating risk. Forecasts suggest the trend will continue upward without intervention, underscoring the urgent need for proactive deterrence and loss prevention strategies.
The graph indicates the dollar value lost due to unwanted repeat customers. The data also reveal geographic disparities: stores 154, 106, and 107, accounting for 38% of total losses, are located in economically marginalized areas near public transit hubs and experienced significantly higher incident rates compared to stores in affluent, vehicle-centric neighborhoods.
The graph above shows the number of unwanted customers, broken down by store.
The graph above highlights three stores where the number of unwanted customers is increasing, while most stores show a declining trend.
The table above shows repeat visits by unwanted customers along with the associated costs.
The table above is designed as a heatmap to highlight unwanted customer visits by day and time. This helps Loss Prevention teams easily identify high-risk periods for better monitoring and response.
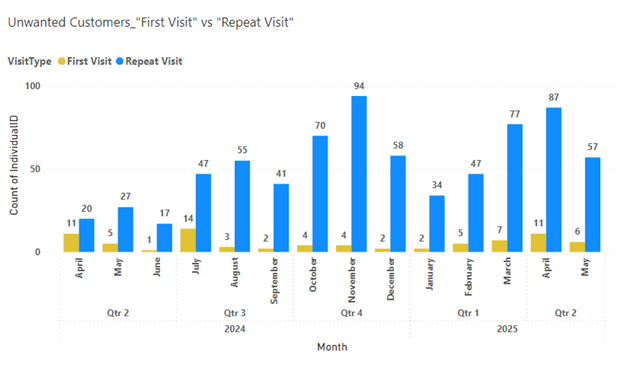
The graph above compares first-time and repeat visits by the same unwanted customers over the given time frame.
Unlocking Revenue Protection in Grocery Retail: i3 AI Sentry at XYZ Grocer
1. Uncovering $372K in Repeat Visit Risk
Over a one-year period, i3Ai Sentry detected 1,124 repeat visits by unwanted individuals across 27 XYZ Grocer locations. At an average loss of $320 per incident, this translates to $372,480 in preventable losses, with total threat exposure reaching $398,080. These insights highlight a substantial opportunity for proactive loss prevention measures.
2. Cutting Repeat Offences Through Real-Time Intervention
Monthly repeat visits peaked at 142 but dropped to 75, a 15.73% year-over-year reduction. In May 2025 alone, there was a 35.34% month-over-month decline, representing a $13,120 savings opportunity.
This success is credited to real-time interventions: when a flagged individual enters a store, Asset Protection receives immediate alerts via the i3 CMS mobile app (see Appendix B: Accessing CMS Mobile) or through an i3 IP speaker announcement with a discreet, staff-only message. Offenders are then professionally escorted out, positioning XYZ Grocer as a leader in proactive retail security.
3. Pinpointing High-Risk Locations with Store-Level Opportunity Mapping
Store-level data uncovered major disparities in threat exposure. Store #154 alone recorded 227 repeat visits, representing $72,640 in potential losses. Several other stores reported over 50 incidents each.
Notably, the data also revealed geographic patterns: locations in economically marginalized areas near public transit hubs experienced significantly higher incident rates compared to stores in affluent, vehicle-centric neighborhoods.
With i3Ai Sentry, XYZ Grocer can now strategically prioritize high-risk locations through increased signage, enhanced staff presence, and targeted patrols, a level of precision that was not previously possible.
4. Pattern Recognition & Offender Profiling
i3Ai Sentry identified repeat offenders like “Female in Black Coat 2,” who entered stores over 102 times, resulting in a potential loss of $32,640.
The system goes beyond simple visit counts—it captures behavioral patterns, time-of-day trends, and store-specific activity. This intelligence enables security teams to anticipate risks and intercept threats before they escalate.
5. Time-of-Day & Day-of-Week Loss Prevention Insights
Analysis revealed that unwanted customer visits peaked on Sundays and Tuesdays between 1:00 PM and 7:00 PM. These spikes align with:
• Tuesdays: Launch of new promotional ads, driving increased foot traffic.
• Sundays: Reduced on-site staffing, particularly in Loss Prevention roles.
Armed with these insights, XYZ Grocer is now adjusting staffing levels and security strategies on high-risk days to proactively reduce losses.
6. The i3 AI Sentry Advantage
Real-Time Offender Alerts: Enables immediate response when flagged individuals enter a store.
Advanced Dashboards: Provide access to detailed visit histories, timestamps, and behavioral patterns to support smarter decision-making.
Seamless Scalability: Deployed across 27 locations using 95 M71 cameras, averaging 3–4 per store, with minimal setup required.
Additional value is delivered through:
Smart Exception Reports that integrate point-of-sale data for deeper insights.
Business Intelligence Metrics such as customer engagement at self-checkout, dwell times, and overall store traffic analysis.
Conclusion: A New Era of Proactive Retail Security
From April 2024 to April 2025, i3Ai Sentry enabled XYZ Grocer to identify and mitigate over $370,000 in repeat offender risk, signalling a shift from passive surveillance to active loss prevention.
What started as a tool to support staffing and vendor oversight has evolved into a critical defense against revenue loss. With targeted insights, real-time alerts, and scalable deployment, XYZ Grocer now sets the standard for modern retail security in the grocery sector.
Over the course of the year, XYZ Grocer invested approximately $109,000 (MSRP) in i3Ai Sentry, with an additional recurring cost of $12,000 per year. This investment has yielded estimated savings of $250,000 annually. (See Appendix A for detailed calculations.)
