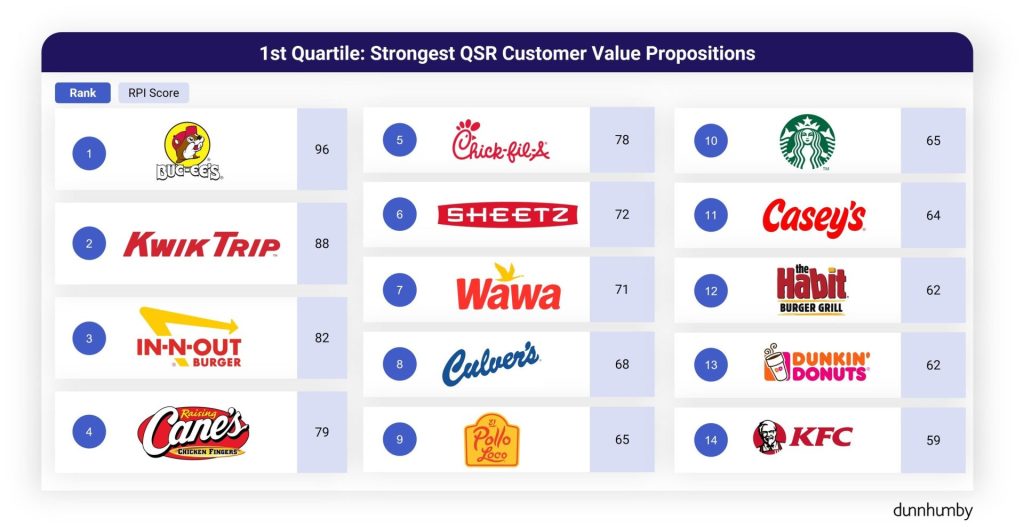
In a recent Dunnhumby customer value report analyzing 58 QSRs and food retailers, convenience stores claimed the top two spots and four of the top 10 positions. Buc-ee’s scored 96 out of 100, eight points ahead of second-place Kwik Trip and a full 14 points above top-rated QSR In-N-Out Burger. Even more remarkable: Kwik Trip earned a 79 for convenience and speed, the highest rating across all 58 companies. That’s right, the fastest order fulfillment time wasn’t a quick-service restaurant. It was a c-store.
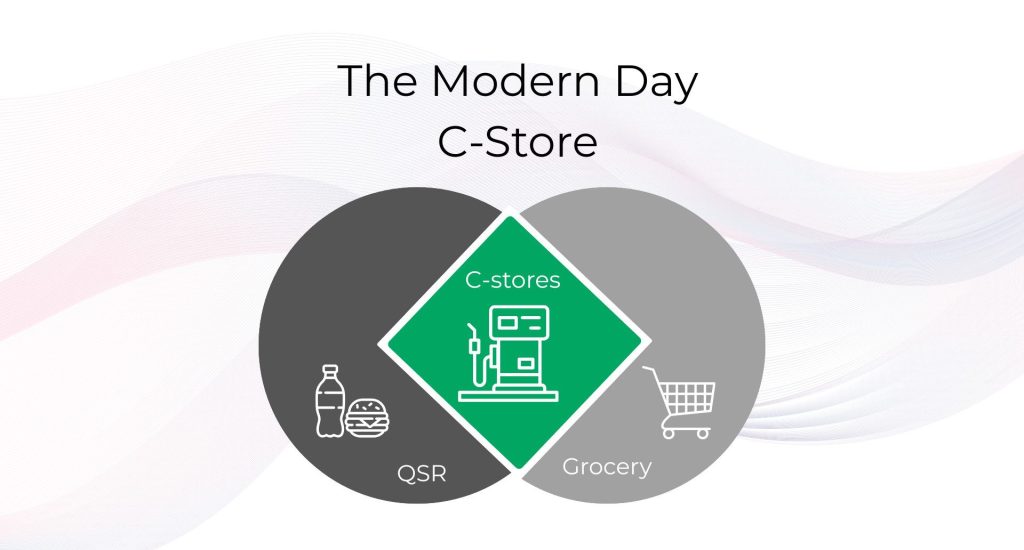
The lines between c-stores, QSRs, and grocery are blurring. As Dunnhumby noted, “the traditional QSR space is ripe for disruption from convenience store chains that go all-in on blurring these lines and do it with the right areas of focus.”
The question for c-store operators is simple: Are you tracking the same metrics that made Buc-ee’s and Kwik Trip industry leaders? Or are you still operating with fuel-focused margins while your competitors adopt food service and grocery best practices?
Here are the top five metrics from QSR and grocery operations that are transforming c-store performance, and how to measure them effectively.
1. Speed of service: The metric that built Kwik Trip’s reputation
Why QSRs track it: Quick-service restaurants live and die by speed. Drive-thru timer screens, kitchen display systems, and velocity tracking are standard because every second counts. Customers expect their order in under three minutes, and brands that consistently deliver build fierce loyalty.
Why it matters even more for c-stores: C-store customers are often in an even bigger hurry than QSR patrons. They’re grabbing breakfast on the way to work, fueling up during a road trip, or picking up lunch between meetings. Kwik Trip’s dominance in speed metrics shows what happens when c-stores take this seriously: they don’t just compete with QSRs, they beat them.
Yet many c-stores still don’t measure speed of service systematically. They might track fuel transaction times, but what about:
- Time from entry to checkout for in-store purchases
- Prepared food order fulfillment speed
- Self-checkout versus traditional register efficiency
- Peak-hour bottlenecks that slow everything down
How i3 measures it: i3 Velocity Timer tracks customer flow from the moment they enter your store to checkout completion. The system identifies bottlenecks during peak hours, measures the impact of prepared food programs on overall speed, and compares performance across locations to identify best practices. For c-stores with drive-thru food service, the same timer technology QSRs use can be deployed to ensure you’re competitive with fast-food alternatives.
2. Customer experience score: What earned Buc-ee’s a 98/100
Why grocery tracks it: Grocery chains invest heavily in experience metrics because repeat business depends on it. They measure everything from store cleanliness to staff friendliness to checkout wait times. These aren’t soft metrics; they directly correlate with basket size and visit frequency.
Why it matters for c-stores: Buc-ee’s didn’t become legendary by accident. The brand scored 98 out of 100 for quality of experience and products, and 99 for variety. Customers don’t just stop at Buc-ee’s; they plan trips around it, spend significantly more than at typical c-stores, and become brand advocates.
But experience isn’t just about having clean bathrooms (though that helps). It’s about:
- Staff engagement and friendliness during transactions
- Store layout that makes finding products intuitive
- Prepared food quality and presentation
- Whether customers feel rushed or welcomed
Industry experts note that “people today are seeking more than minutes saved, they’re looking for meaning made.” Even in a convenience-focused environment, emotional connection matters.
How i3 Measures It: i3 Employee Engagement uses Ai-powered monitoring to track customer-staff interactions across sales floors, registers, and food service areas. The system identifies patterns that correlate with positive experiences: Are staff greeting customers? How long do customers wait for assistance?
Combined with i3’s Trajectory Analysis, you can see where customers linger versus where they quickly pass through, revealing which areas create positive engagement and which create frustration. This isn’t subjective feedback; it’s behavioral data that shows exactly how customers experience your store.
3. Product variety and assortment performance: The hidden differentiator
Why both QSR and grocery obsess over it: QSRs constantly test limited-time offers and seasonal items to drive traffic. Grocery chains use planogram optimization and category management to maximize per-square-foot revenue. Both industries know that the right variety drives sales, and c-stores are now incorporating fresh goods and items that before were only available at supermarkets. This allows for c-stores to become a one-stop for all, adressing consumers’ needs for products and efficiency while shopping.
What c-stores are doing about it: According to Dunnhumby’s research, Buc-ee’s, Wawa, and Kwik Trip were the top three for food variety, while Buc-ee’s, Sheetz, and QuickChek led in beverage assortment. But here’s the critical insight: variety matters differently to different customers.
“Variety matters differently to different customers, and winning retailers Buc-ee’s, Wawa and Sonic know how to deliver it,” the report notes.
The mistake many c-stores make is treating variety as “more is better.” The smarter approach is understanding:
- Which products actually drive foot traffic versus which sit on shelves
- How assortment should vary by location, time of day, and customer demographics
- Whether your prepared food offerings are cannibalizing packaged goods sales (or vice versa)
- Which high-margin items are getting lost in cluttered displays
How i3 measures it: i3 Heat Mapping reveals which products and displays actually attract customer attention. Combined with i3 Smart-ER exception reporting, you can correlate foot traffic patterns with POS data to identify:
- High-traffic areas with underperforming product placement
- Popular items that are frequently out of stock
- Low-performing SKUs taking up prime real estate
- Optimal merchandising layouts based on actual customer movement, not assumptions
As we explored in our analysis of AI-powered insights transforming grocery operations, retailers using these tools can “translate operational data into tangible improvements in layout, inventory, and customer experience.”
4. Employee engagement and productivity: The multiplier effect
Why grocery prioritizes is: Grocery stores depend on frontline staff to manage everything from stocking shelves to assisting customers to preventing shrink. Doug Baker of the Food Marketing Institute emphasizes that for instance, during the holiday rush, “customers are rushing, employees are stretched thin and the margin for error narrows.” High turnover costs grocers thousands per employee in recruiting and training. Engaged employees provide better service, make fewer mistakes, and stay longer, directly impacting both customer experience and profitability.
Why c-stores need to incorporate employee engagement urgently: The Oakland 7-Eleven story illustrates the crisis: repeated robberies made it “nearly impossible to hire employees, especially for overnight shifts.” But the issue goes beyond security. Low engagement leads to:
- Poor customer service that drives traffic to competitors
- Increased shrink from both internal and external theft
- Higher turnover, creating constant training burden
- Inconsistent execution of food service programs
Industry data shows that 90% of asset protection leaders cite security and 85% cite people safety as top responsibilities. Yet many c-stores still lack systematic ways to measure engagement beyond turnover rates and incident reports.
How i3 measures it: i3 Employee Engagement tracks real-time staff-customer interactions, identifying patterns that indicate high or low engagement. The system monitors:
- Customer greeting rates and interaction quality
- Time spent assisting versus time spent on back-office tasks
- Consistent execution of food service standards
- Behavioral patterns that correlate with shrink incidents
This isn’t about surveillance; it’s about supporting your team with data that helps them succeed. When employees know their positive interactions are recognized and supported, engagement naturally improves.
5. Traffic count and conversion: Turning visits into sales
Why grocery obsesses over it: Grocery chains know that getting customers in the door is only half the battle. The real metric is conversion: What percentage of foot traffic becomes a transaction? And of those transactions, what’s the average basket size? They optimize everything from store layouts to checkout processes to maximize both.
Why c-stores are leaving money on the table: C-stores often have high traffic counts due to fuel sales, but many operators don’t know:
- What percentage of fuel customers also come inside
- How long customers spend in-store before deciding to purchase (or leave empty-handed)
- Which areas of the store attract browsing versus which are ignored
- Whether your prepared food displays are positioned to capture impulse purchases from fuel-only customers
As experts note, grocers must move beyond demand prediction to “prescribe action” by leveraging unified customer profiles, inventory intelligence, and Ai-powered recommendation engines. The same principle applies to c-stores: where an understanding of traffic patterns is necessary to influence consumer behavior.
How i3 measures it: i3 People Counting integrated with Trajectory Analysis provides a complete picture:
- Total foot traffic versus transaction count (your true conversion rate)
- Dwell zones in different store sections
- Path-to-purchase patterns (Do customers who enter from fuel pumps follow predictable routes?)
- Peak traffic times that require additional staffing or prepared food inventory
- Dead zones that represent lost merchandising opportunities
Combined with POS integration through i3 Smart-ER, you can correlate traffic patterns with actual sales to identify exactly which operational changes drive revenue, not just guesses.
The integration advantage: Why these metrics work better together
Here’s what separates industry leaders from everyone else: these metrics are not tracked in isolation.
When Kwik Trip delivers the fastest order fulfillment, that speed is supported by optimal staffing (employee engagement), smart product placement (assortment performance), and efficient store layouts (traffic flow optimization). When Buc-ee’s earns a 98 for experience, it’s because they’ve integrated variety, speed, cleanliness, and staff engagement into a cohesive system.
C-stores trying to compete with point solutions (a POS system here, a time clock there, maybe some security cameras) will always lag behind operators using integrated platforms that reveal how these metrics interconnect.
For example:
- High traffic but low conversion might indicate poor product assortment, or slow service, or disengaged staff; without integrated data, it’s just guessing
- Strong prepared food sales but declining overall transactions could mean your food program is cannibalizing other purchases rather than adding incremental revenue
- Excellent speed of service scores but poor customer experience ratings suggests your efficiency is coming at the cost of friendliness
i3’s ecosystem approach means Velocity Timers, Trajectory Analysis, People Counting, Employee Engagement, and Smart Exception-Based Reporting all feed into a unified operational picture. You’re not managing five separate systems; you’re seeing how speed, experience, assortment, engagement, and traffic flow interact to drive your business.
The competitive reality: C-stores are disrupting QSRs and grocery
Dunnhumby’s conclusion is clear: “This underscores the point that the traditional QSR space is ripe for disruption from convenience store chains that go all-in on blurring these lines and do it with the right areas of focus.”
The “right areas of focus” are exactly these five metrics. Buc-ee’s, Kwik Trip, Wawa, and Sheetz didn’t accidentally become QSR competitors; they deliberately adopted the operational rigor that made QSRs and grocery chains successful, then executed better.
The question is whether your c-store is equipped to integrate all this data and provide you with a better picture of where to action it, and how to address inefficiencies.
Ready to learn how your c-store can apply these metrics to enhance your operations with i3 International? Request a demo to see how industry-leading c-stores are using integrated Ai-powered solutions to compete and win against QSRs and grocery chains.
")

