
For one Midwest grocer with 27 stores, the answer was $250,000 in annual savings on a $109,000 investment. Here’s how the math actually works, and the cost categories most operators miss.
Most operators we talk to have already heard the pitch. AI cameras catch shoplifters faster. Smart analytics find shrink. Cloud platforms cut IT overhead. The promises are everywhere. The honest question, the one that actually keeps retailers (mid-market grocers, c-store operators, QSR groups, and regional retailers) up at night, is whether any of that translates into real money on the P&L.
It’s a fair question to ask in 2026. According to the National Retail Federation’s Impact of Retail Theft and Violence 2025 report, retailers logged a 19% increase in combined shoplifting and merchandise theft incidents from 2024 alone. The cost of doing nothing keeps going up, which means the cost-benefit math of any security investment matters more than it used to.
So let’s do this properly. We’ll walk through what AI video ROI actually means, look at one regional grocer who measured it across 27 stores, and unpack three categories of savings that most security spend conversations skip entirely.
What does “ROI from AI analytics video” actually mean?
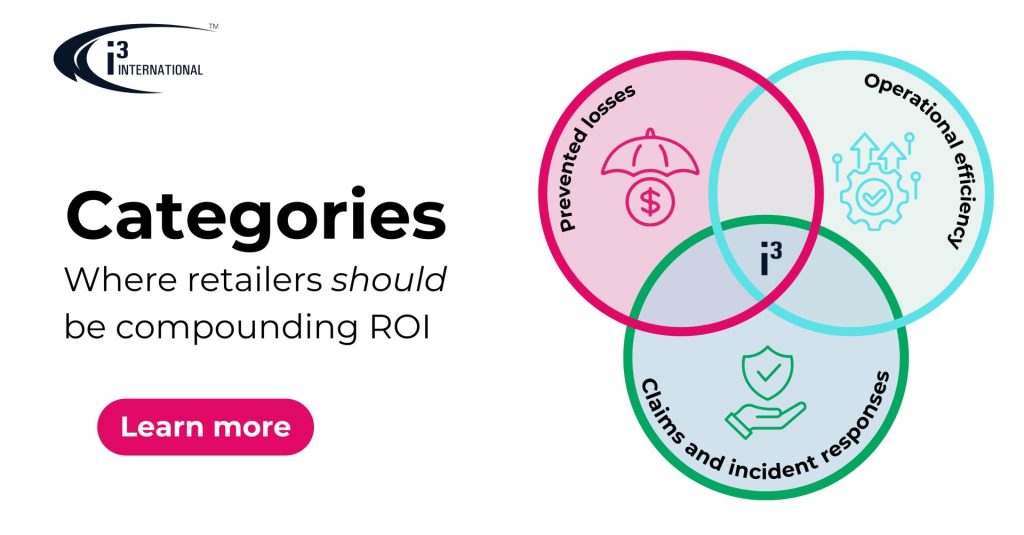
When operators ask about ROI from AI analytics video, they usually mean shrink reduction. That’s the obvious category, and it’s important. It’s also only the first of three places the math compounds.
Prevented losses. Theft, fraud, POS exceptions, cart pushouts, sweethearting, and repeat-offender activity. The dollars you would have lost without the system in place.
Operational efficiency. Labor optimization, drive-thru speed-of-service gains, accurate people-counting that fixes staffing schedules, heat-mapping data that improves layout and conversion, and the hours your team spends reviewing footage manually that you can give back to higher-value work.
Claims defense and incident response. Faster response to slip-and-fall incidents, time-stamped video records that defend against fraudulent claims, faster investigation cycles on POS exceptions, and verified camera coverage that keeps your insurer comfortable.
A real ROI conversation adds all three together. Most vendor pitches show you only the first. Closing that gap is the goal of this post.
A real number on a real grocer
In April 2024, a regional grocer that operates more than 30 stores across the Midwest deployed i3Ai Sentry across 27 of its locations. Three to four cameras per store, ninety-five M71 cameras total. The goal was straightforward: flag repeat-offender activity and deter it in real time, instead of finding out about losses weeks later in a shrink reconciliation.
One year later, the data was evident. The system flagged 1,124 repeat visits across the chain. At an average loss of $320 per incident, that represented $372,480 in preventable losses. Monthly repeat visits peaked at 142 and dropped to 75 within the year, a 15.73% year-over-year reduction in repeat-offender activity.
The investment was approximately $109,000 (MSRP) in i3Ai Sentry, with an additional $12,000 in recurring annual cost. Estimated annual savings landed at $250,000.
Run the math the way a CFO would. Year one returns more than two times the deployment cost. Every year after that, the recurring spend is less than 5% of the savings it generates. These numbers are documented across twelve months of deployment data, not pulled from a marketing projection.
The reason this works is worth understanding. Sentry didn’t catch more shoplifters by being faster on the trigger. It surfaced the operational signals that a human team can’t see by reviewing tape after the fact: which of the 27 stores carried the highest exposure, which days of the week generated the most incidents (Sundays and Tuesdays between 1:00 PM and 7:00 PM), and which repeat visit patterns drove outsized loss. One pattern alone, matched by the system across stores, accounted for $32,640 in potential loss across 102 visits. That kind of operational intelligence is the difference between guessing where to deploy LP resources and knowing.
Where the savings actually live (it’s wider than shrink)
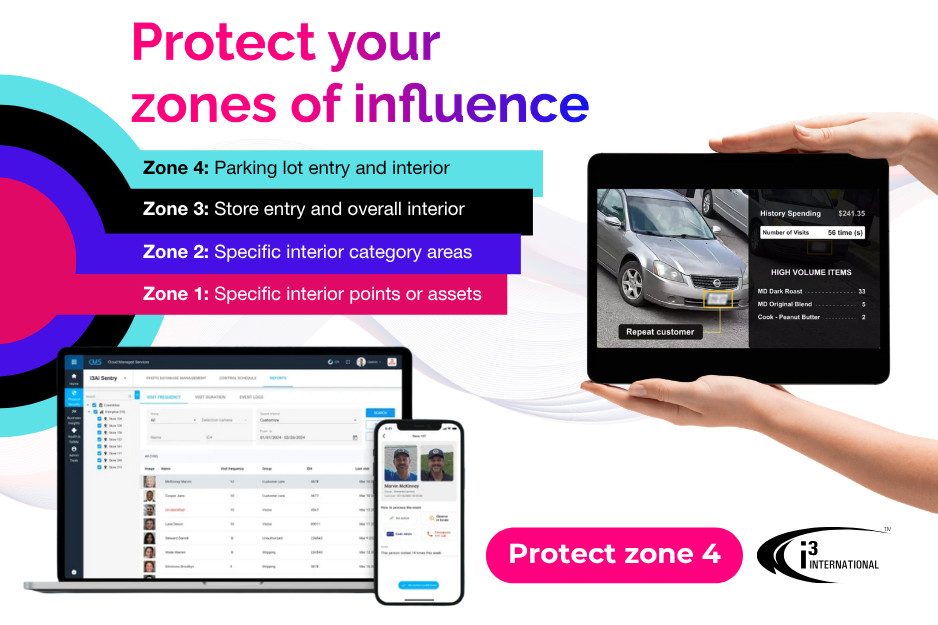
Once you accept that the math works on loss prevention alone, the next question becomes which other categories you’re leaving on the table. A useful way to map that out comes from the Loss Prevention Research Council (LPRC), whose Zones of Influence model describes loss prevention as a set of concentric zones rather than a single point at the shelf.
The logic is that an offense doesn’t happen in one place. It travels inward. An offender starts in the surrounding community and cyber space (Zone 5), moves into the parking lot (Zone 4), enters the store and its general interior (Zone 3), reaches the specific category area where the target sits (Zone 2), and finally acts on the asset itself (Zone 1). Place the right awareness and response technology across those zones and you get two things at once: more chances to deter the offense before it happens, and a better evidence trail if it does.
That zone-by-zone view also happens to be the clearest way to see why AI video ROI compounds. i3 transforms video, POS, trajectory, door-count, and safety-related operational signals into privacy-conscious operational intelligence that helps retailers improve safety, reduce loss, and operate more efficiently across these zones of influence. The savings below all come out of that same operational intelligence layer, which is why a single deployment generates compound returns instead of one narrow benefit.
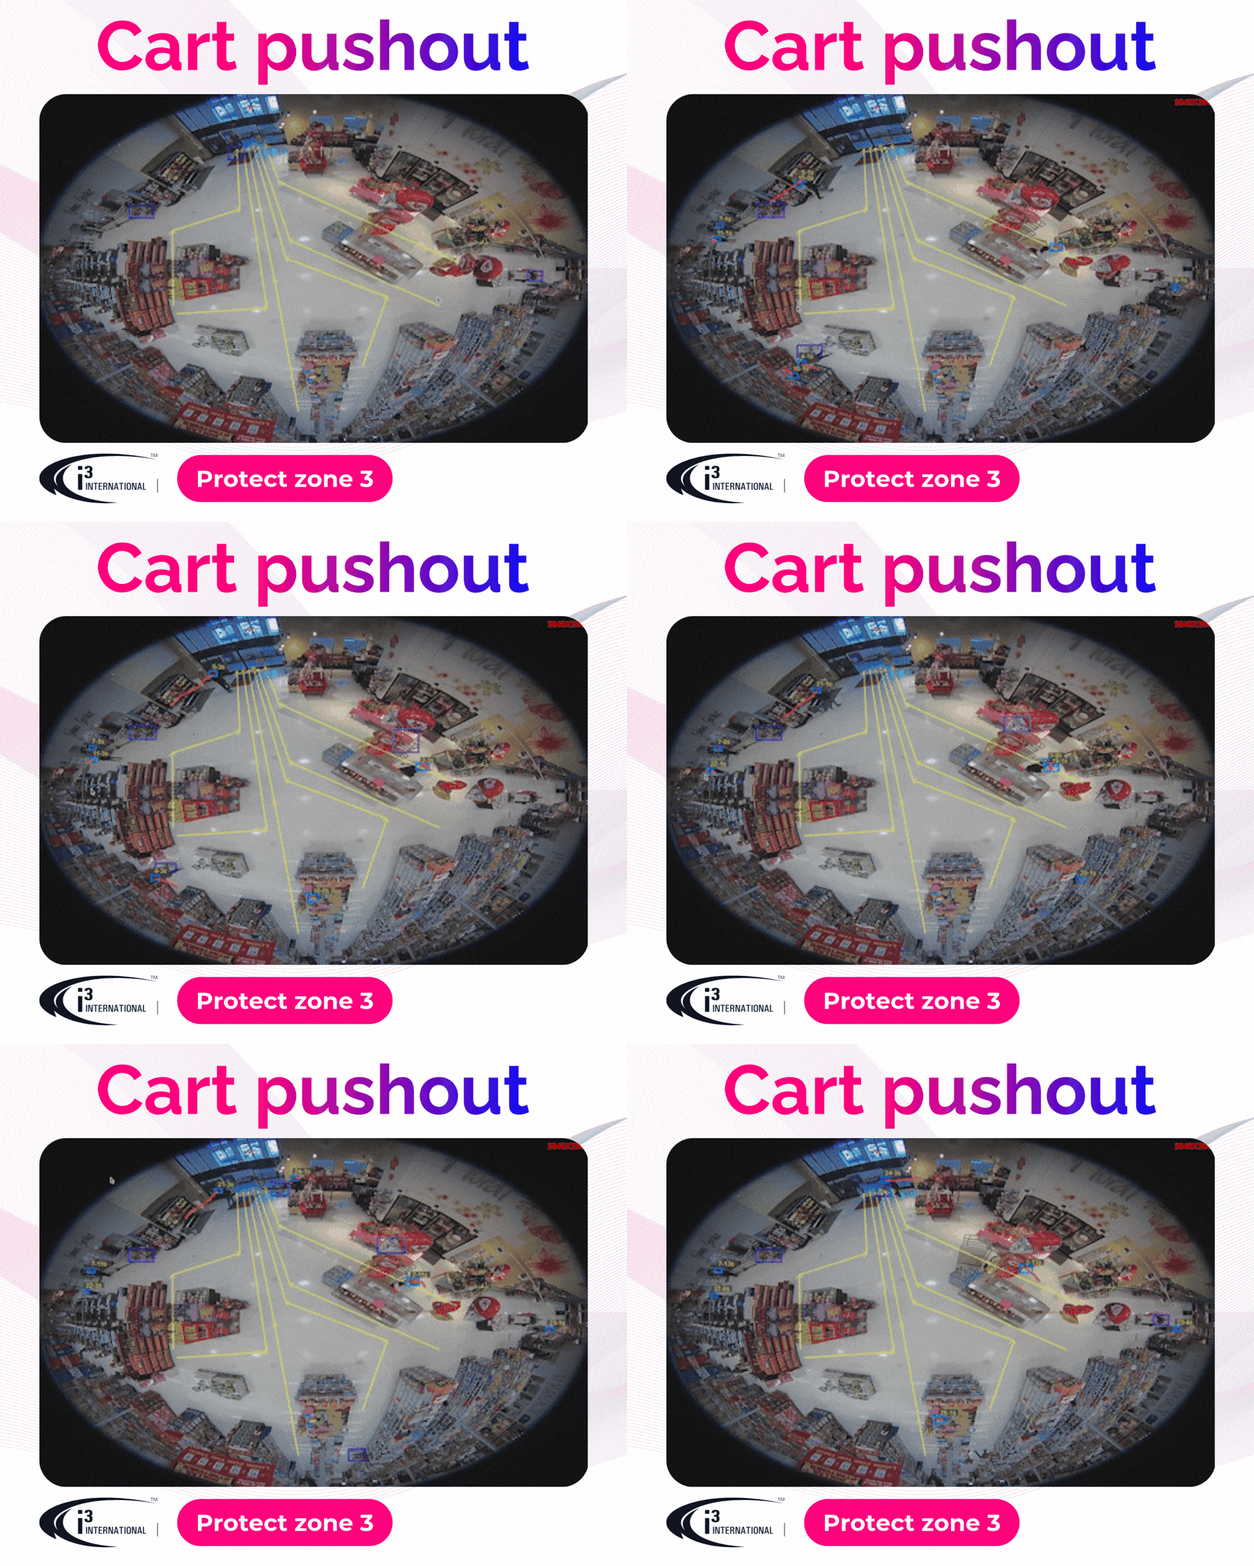
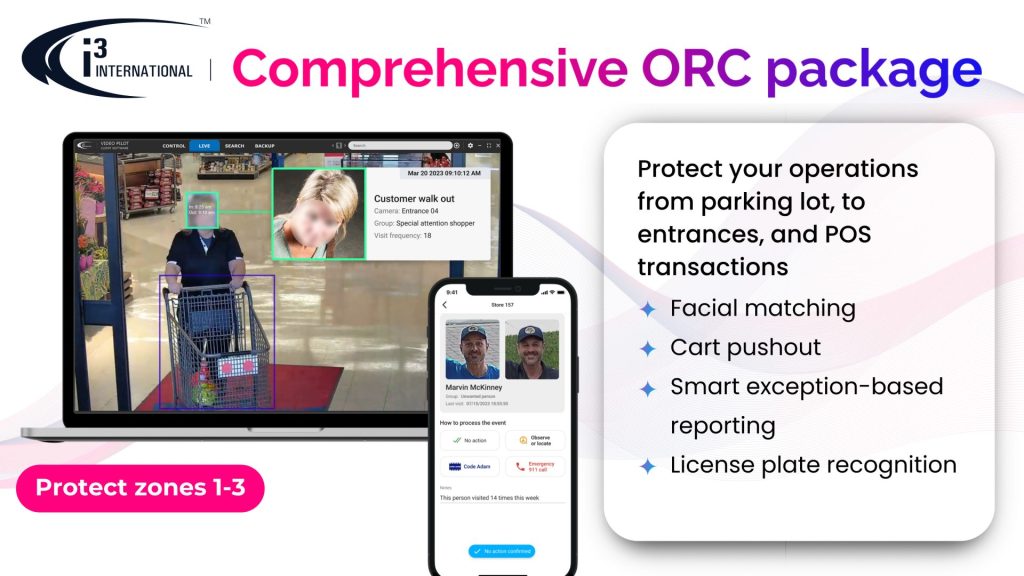
On the asset protection side (Zones 1, 2, and 4), i3Ai Smart-ER works at the asset and point of sale (Zone 1), tying POS exceptions to synchronized video so investigations that used to take hours of footage review surface automatically. Trajectory Anomaly covers the category areas and exits (Zones 1 and 2), flagging cart pushouts and unauthorized exits in real time. License Plate Recognition pushes detection all the way out to the parking lot (Zone 4), turning it into an early-warning layer based on lists your team configures with our easy IP Speaker implementation.
On the operational side (Zones 2 and 3), Velocity Drive-Thru Timer measures every stage of the drive-thru lane, which for QSR operators translates directly to cars served per hour. People Counting and Conversion work at store entry and across the interior (Zone 3), telling you whether your foot traffic is actually converting. Heat Mapping goes deeper into the category areas (Zone 2) to show where in your store conversion drops off. Employee Engagement shows whether your front-line team is actually with customers when they should be. The grocery deployment above runs these alongside Sentry: the same video infrastructure powers loss prevention, staffing decisions, and layout optimization without paying for three different systems.
On the safety and security side (Zones 3 and 4), Slip, Trip, and Fall detection covers the store interior (Zone 3) and alerts staff in real time, which both speeds response and creates the time-stamped video record that defends against fraudulent claims (a category of cost most operators absorb quietly into their insurance line every year). i3Ai Loitering Detection extends from the lot to the entrance (Zones 3 and 4) and i3Ai Obstruction Detection guards entries and emergency exits (Zone 3), both generating alerts when activity crosses operational thresholds without anyone having to watch a screen.
On the camera-health side, i3 True View verifies that your cameras are actually capturing what you think they’re capturing. A camera that’s been blocked by a stack of pallets for six months is an expensive blind spot. It’s also a problem when a claim shows up and the footage isn’t there.
Notice the pattern. These capabilities span Zone 4 at the parking lot all the way to Zone 1 at the asset, and each one runs on cameras you may already have, on a platform that handles them all in one place. You aren’t buying a different system for each zone. You’re getting compound returns from a single deployment that covers the whole journey an offense travels.
Three questions to test the value of the impact of AI video analytics on your business
If you’re evaluating AI video analytics for your business (ours or anyone else’s), these three questions usually surface whether the impact is real.
- Which categories of savings is the vendor counting? If they’re only showing you shrink, ask for the operational and claims-defense lines. If those aren’t there, the model is incomplete.
- Where’s the case study with actual numbers? Industry averages are fine for sizing the problem. They’re not enough to justify a purchase order. Look for documented per-store data, like the 27-store deployment above.
- Is it one platform or many? If the vendor wants to charge you for separate systems to handle loss prevention, operational analytics, slip-and-fall detection, and camera health, you’ll be stitching together dashboards (and budgets) for the rest of the deployment. The compound ROI lives in one platform processing all of your operational signals at once.
How many zones of interest does the technology address?
Modern AI video analytics, deployed properly, behave more like an investment than a security expense. It returns multiple categories of value on a single piece of infrastructure, and the operators who measure all three see returns that justify the deployment many times over.
That’s the honest version of the ROI story.
Ready to model the numbers for your environment? Schedule a call with our team and we’ll walk through the categories that matter for your business: your vertical, your store count, and your current shrink and operational profile.
Sources: National Retail Federation, The Impact of Retail Theft & Violence 2025, October 2025. Loss Prevention Research Council, What is the LPRC Zones of Influence?. i3 International, How a Regional Grocer Uncovered Over $370,000 in Preventable Losses with i3Ai Sentry, July 2025.